Ironman UK Power Graph
 The power graph you see above was produced by one of the athletes I coach--Eric VanMoorlehem. It is from Ironman UK on August 19. Eric races in the 35-39 age group. He had a difficult preparation for IMUK due to a nagging Achilles tendon inflammation which stayed with him most of the summer. Because of this he didn't run much. He also felt the bike aggravated the Achilles (he has switched over to a midsole cleat position since the race to take the load off of his Achilles and calf). So he was a bit limited on training there also. So he went in to the race with both of us concerned that he may not qualify for Hawaii which he had done each of the last two seasons. There were three IM slots in his age group and we couldn't count on a roll down so we felt he had to get 3rd.
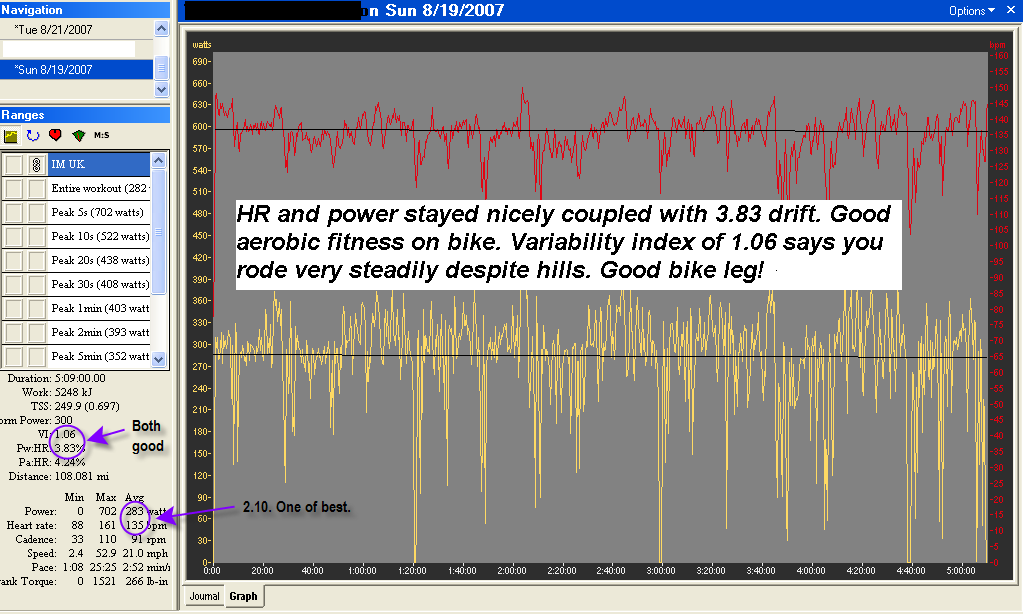
Eric is very good at maintaining a steady and consistent power output despite hills and even heat. This is evidenced by his 1.06 variability index (VI). VI is determined by dividing normalized power by average power. A VI of 1.0 would mean perfect pacing, but hills make this quite a challenge. IMUK was quite hilly.
He posted a 5:09 which is 18 minutes slower than his best IM bike split. He started the run in first place in his age group and ran as best he could given his limited run training coming into the race. He ran a 3:21 and finished in 9:33 for a 3rd place--22 seconds ahead of 4th. So he did qualify.
What I especially like about this graph is how little "decoupling" there is between power and heart rate over five hours of riding. Decoupling is basically a measure of cardiac drift. But, of course, heart rate could could stay constant with power drifting downward during the race. So rather than refer to this as drift I call it decoupling. The power and heart rate graphs remain almost perfectly parallel throughout this race graph. He experienced only 3.83% decoupling. I like to see this be less than 5% in a steady-state race such as a triathlon or time trial. Contrast Eric's decoupling with that in the race graph below. You can see a significant difference.
posted by Joe Friel @ 4:57 PM
26 Comments
![]()
![]()


26 Comments:
Hi Joel-
I'm wondering if decoupling is less likely to happen at lower HR / Power outputs. In the IMUK example, your athlete's average HR is about 135, well below his max. But the TT from the previous example was a shorter more intense effort, with an average HR much closer to the athlete's limit.
If I can maintain a steady power output within a consistent HR for long tempo efforts, does it mean I should also be able to maintain a steady power output at a consistent HR at threshold?
Mike--Good insight. Decoupling is only appropriately measured when riding aerobically. When in good aerobic condition you should be able to ride for lengthy periods of time with minimal decoupling. I find many athletes who decouple within an hour in HR zone 2. What you see in this example is a coupled zone 2 effort for 5 hours.
Is that IF correct in the cyclingpeaks picture. That would make his FTP around 430? Amazing if it is true!
Anon--Yes, that's right. Around 430w. He is 6'8" and 200 pounds. You can't miss him in a race.
To get the 430 watt FTP, are you guys dividing (.697) into his average power for the ride?
If so, does this mean that theoretically a person could take any somewhat steady-state ride and do the same thing to calculate FTP?
Thanks.
Hi Joe
Very interesting read. I'm interested in the VI and Pw:HR data, particularly as my CyclingPeaks package doesn't display the latter!
Anyway, that aside, you say that the figures of VI at 1.06 and Pw:HR at 3.83 are "good". Unfortunately I don't really know what the range would be and how you would define them given your experience. What would you regards as approximate figures for "Good", "Average", and "Poor" for example, what's the performance range?
Thank you for your help.
Anon--See my comment above on how to get those features set up on your WKO+.
For VI in a steady state event such as TT or tri I like to see 1.05 or lower. Hills mess this up some. He rode a hilly course at 1.06, so he did well and holding a steady output.
I like to see decoupling less than 5% in such events. There is no average or poor. There is only acceptable and unacceptable. The athlete has no control over this other than to get in excellent aerobic condition (and adapted to race day conditions such as heat and altitude).
eric--Yes, that's determing FTP backwards from race power and IF (0.697). No you really couldn't work out FTP the way as you suggest (dividing steady state power by IF) because FTP is necessary to know IF.
Hi Joe
Thanks or the information. You said:
"Anon--See my comment above on how to get those features set up on your WKO+.
I think I'm being thick here, I can't see this information anywhere. I checked with the TrainingPeaks people and I think your software is a Beta release and not available to the likes of me so my package doesn't display this data, unless I'm missing something! :-(
Best regards.
anon--Sorry, it was in the post comments below rather than above. Here's what it says...
Close Cycling Peaks/WKO+. Right click on the software icon and select "properties." In the field named "Target", after the last quote mark, hit the space bar _once_ and then enter /pwp. Close properties. Open Cycling Peaks/WKO+. You should now have that feature on the graph page. If you don't then your version of the software is too old and you need to upgrade.
Hi Joe,
Can you explain how the metric you are using for "decoupling" (Pw:HR)is calculated? What does it mean if this is a negative value?
Also what is Pa:HR?
Thanks
Joe
Thanks for the information as to how to get the data displayed, it worked and it's very helpful. I think I now understand the VI figure and the pw:HR figure but can you tell me what the significance/value/use of the Pa:HR figure is please? I'm assuming this is the ratio of average power to HR rather than the ratio of power to HR (Pw:HR)?
Thank you.
Anon--It's average power divided by average HR comparing the first half with the second half of the workout or selected segment. What you're measuring is how much power or HR drifted during the selection.
Another anon asked--"...can you tell me what the significance/value/use of the Pa:HR figure is please?" This is a pace-HR ratio used in running. It's the parallel of power-HR for cycling. The soon-to-be-released version of Cycling Peaks/WKO+ will allow you to download a GPS device and analyze running just as you do with cycling. The key to this is normalized pace which takes into account hills. From this TSS can be determined (along with Intensity Factor and duration).
Hello Joe.
This is great information and very interesting. Is there a similar way to analyse just a heart rate file for drift? Or must you attach a performance to the equation.
Sincerely Steve Neal
Forgot to mention one thing.
Do you think using pace to heart rate with gps for mountain biking would suffice?
Also, is this a valuable metric for monitoring efforts as seen in mountain bike?
Thanks so much.
Steve
IS there any significance to a negative percent?
I have sent an email as I didn't know how to post a picture on here for everyone to see.
MTB race from an athlete who had personal best in race.
Steve
Steve--Negative Pw:HR indicates that in the second half of the workout/race HR and power came more in alignment than in the first half. The first half's greater range of difference could have been due to nervousness, diet (i.e., caffeine), greater variability in effort, etc.
Steve--Regarding Pa:HR in MTB racing... I'm not sure but expect it would be hard to draw conclusions about the MTBer's performance from this as course variability is so extreme in the sport. Power would be much better. But it may be of some benefit. I'd be interested in hearing what you find.
Steve Neal asked--"Is there a similar way to analyse just a heart rate file for drift? Or must you attach a performance to the equation."
Right now you need an output measure (power or pace) to compare with HR to draw conclusions. Drift must be relative to something. But there may some day be software that does this based only on perhaps effort.
Thanks Joe.
I will keep looking at race files and see what I find and will share anything if I think it is worthy.
Thanks for your time and hope you are well.
Steve
If decoupling does occur, would you suggest the athlete pace the Ironman bike leg via HR or power?
BP
Anon--If this happens, and it never did in the later stages of Build training, then you have to assume there is something wrong which is usually going out too fast and failing to pay attention to power early in race, poor nutrition, poor tapering/peaking, or just having a bad day (that happens too). If any of these things are going on and you are decoupling more than 10% (HR rising more than 10% while power stays constant) AND you are feeling weak you have no choice but to slow down and use RPE as your pacing guide.
Joe - how do you have your clients deal with decoupling in endurance training sessions?
Do you prefer them to keep their HR within a prescribed zone and let power gradually fall, or are you happy for them to find a level of sustained power output that results in an average target HR within the prescribed zone?
Andrew--I do it both ways. In the base period I tend to use HR as the fixed point and observe power relative to it. In the Build I usually have them ride a steady power and observe HR changes. The reason for this is that in the Base period power (FTP) may be changing weekly as fitness increases. HR is a more predictable metric at this time of year. In the Build period I like them to use power because that is also how I want them to race, especially long, steady races such as TTs and triathlons.
I recently compared some steady-state AeT rides from the last few weeks to some from the end of my base period last winter. I use the same 60 mile dead-flat course, so it provides a nice laboratory.
Here's what I found: In both periods, VI is between 1.02 and 1.04, average power is around 210w, and my decoupling is between 2 and 5%. However, right now, my average HR is consistently 8 to 12 beats higher than it was last winter.
What do you make of my not decoupling but having an elevated HR?
Thanks and Happy Thanksgiving!
Post a Comment
<< Home